

Critical | Tryhackme Walkthrough
Digital Forensics: Memory Analysis using Volatility3

Task 1: Introduction
Incident Scenario
Our user "Hattori" has reported strange behavior on his computer and realized that some PDF files have been encrypted, including a critical document to the company named important_document.pdf. He decided to report it; since it was suspected that some credentials might have been stolen, the DFIR team has been involved and has captured some evidence. Join the team to investigate and learn how to get information from a memory dump in a practical scenario.
Learning Objectives
In this room, we'll cover the following learning objectives.
Gathering information from the compromised target.
Search for suspicious activity using the information obtained.
Extracting and analysing data from memory.
Conclusion & further steps after completing the room.
Learning Prerequisites
An understanding of the following topics is recommended before starting the room:
Task 2: Memory Forensics
In cyber security, memory forensics is a subset of computer forensics that analyzes volatile memory, usually on a compromised machine; in Windows OS, it corresponds to the Random Access Memory (RAM), and its content is flushed with every reboot or shutdown, making it one of the usual initial task to perform during an incident. The process differs from disk forensics analysis since it not only provides information about what resides on the target computer but also provides us with information about the processes or applications that were running at a particular time and detailed information on the execution flow on a system that may not be present in regular storage units or application logs.
This memory analysis can help us with an immediate snapshot of an application's or a timestamp of an attacker's actions. This is crucial since evidence collected through memory forensics can become invaluable in creating a chronology of events.
We can divide the tasks in a Memory forensic task into two main phases:
Memory Acquisition
Memory Analysis.
During the memory acquisition phase, we'll copy the live memory to a file, commonly referred to as a dump, to perform the analysis without risking losing the data from an inadvertent reboot on the compromised system and have proof of the analysis inc as needed.
Next, during the memory analysis phase, we'll analyze the obtained memory dump of the forensic data.
- What type of memory is analyzed during a forensic memory task?
Ans: RAM
- In which phase will you create a memory dump of the target system?
Ans: Memory Acquisition
Task 3: Environment & Setup
Imaging Tools
There are several ways to acquire the memory from the target machine if needed**; several tools** can help us, but which one to use will depend on personal preference and the OS involved in the imaging task.
Some of these tools are:
| Windows | FTK imager, WinPmem |
| Linux | LIME |
| macOS | osxpmem |
In our scenario, FTK Imager was used to take the memory dump of the compromised machine, which was copied to the Linux machine to perform the analysis.
A memory dump named memdump.mem will be present at the home address at /home/analyst
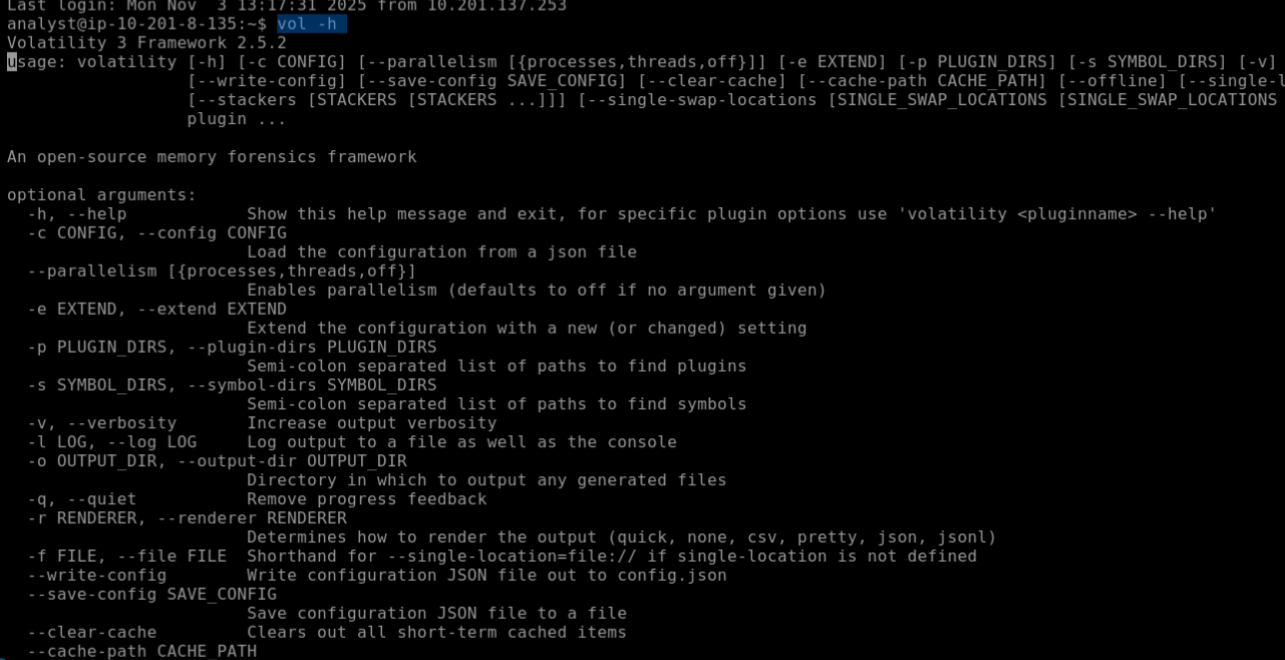
To analyze the memory dump, we use Volatility 3, a common tool for memory forensics. typing vol runs Volatility3. Using -h displays the help menu.
Since we’re examining a Windows memory dump, we can list Windows-specific plugins with:
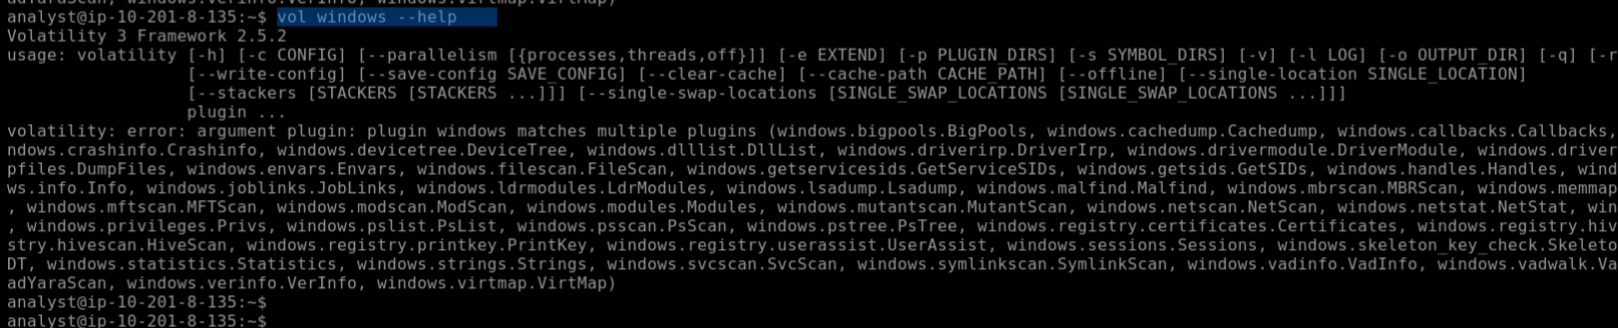
Plugins are extremely helpful during the analysis when using Volatility3 since they will quickly parse a memory dump for specific data types and sort the data. summary of some of the most relevant plugins below
| Windows.cmdline | Lists process command line arguments |
| windows.drivermodule | Determines if any loaded drivers were hidden by a rootkit |
| Windows.filescan | Scans for file objects present in a particular Windows memory image |
| Windows.getsids | Print the SIDs owning each process |
| Windows.handles | Lists process open handles |
| Windows.info | Show OS & kernel details of the memory sample being analyzed |
| Windows.netscan | Scans for network objects present in a particular Windows memory image |
| Widnows.netstat | Traverses network tracking structures present in a particular Windows memory image. |
| Windows.mftscan | Scans for Alternate Data Stream |
| Windows.pslist | Lists the processes present in a particular Windows memory image |
| Windows.pstree | List processes in a tree based on their parent process ID |
Now that we know how to access our environment and which tools we will use, let's move to the next phase, where we'll start analyzing the data.
Answer the questions below
Which plugin can help us to get information about the OS running on the target machine?
Ans: Windows.info
Which tool referenced above can help us take a memory dump on a Linux OS?
Ans: LIME
Which command will display the help menu using Volatility on the target machine?
Ans: vol -h
Task 4: Gathering Target Information
Getting information about the target system is important because it helps us make sure we’re analyzing the machine that was compromised involved in the incident
We can do this by using the -f option to choose the memory file (memdump.mem) and the windows.info plugin to get general system details:
| python3 vol -f memdump.mem windows.info |
This command shows useful information such as the system’s architecture, number of processors, and Windows version.
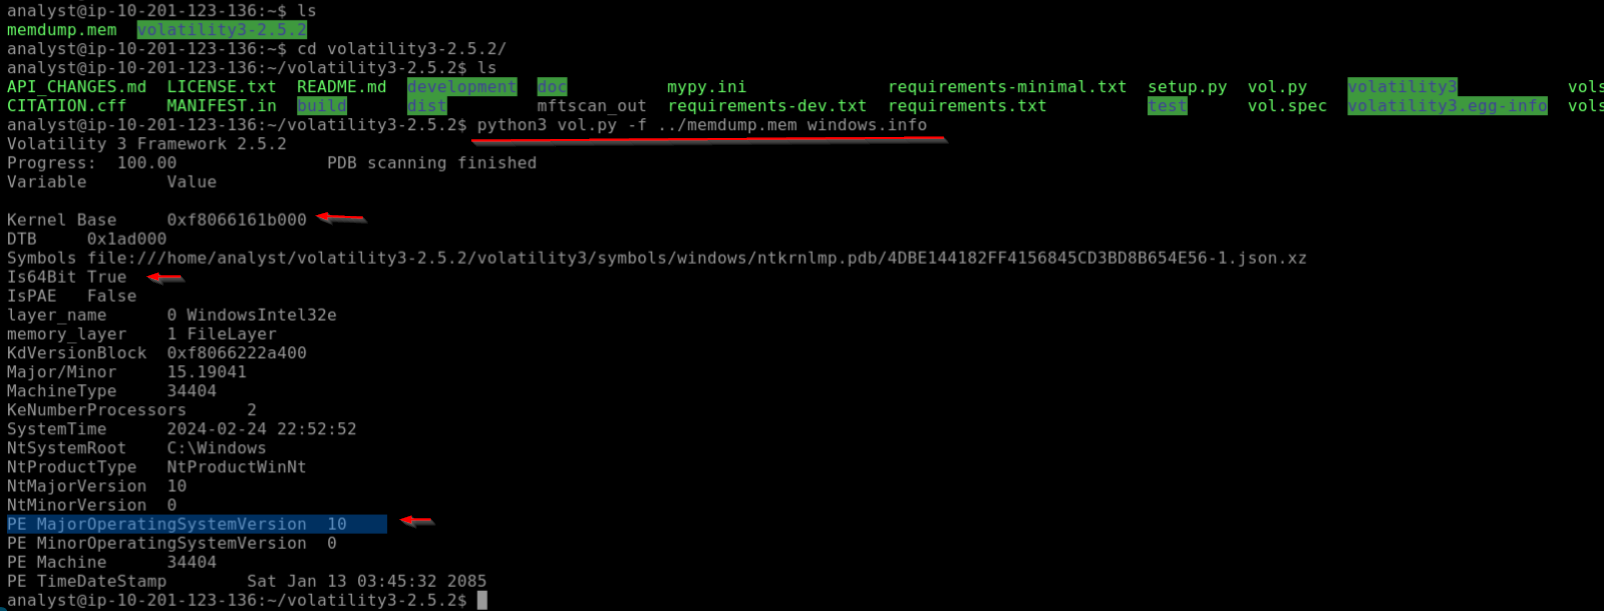
Answer the questions below
Is the architecture of the machine x64 (64bit) Y/N?
Ans: Y
What is the Verison of the Windows OS
Ans: 10
What is the base address of the kernel?
Ans: 0xf8066161b000
Task 5: Searching for Suspicious Activity
Let's try to identify any suspicious activity in the memory dump.
Suspicious activity refers to technical anomalies that may be present in a system, such as unexpected processes, unusual network connections, or registry modifications. These activities often signal potential security threats like malware attacks or data breaches.
We can identify a possible malicious process and should note the information, like timestamp, PID, PPID, and Memory offset.
Answer the questions below
- Using the plugin "windows.netscan". Can you identify the destination IP address where a connection is established on port 80?
Ans: 192.168.182.128
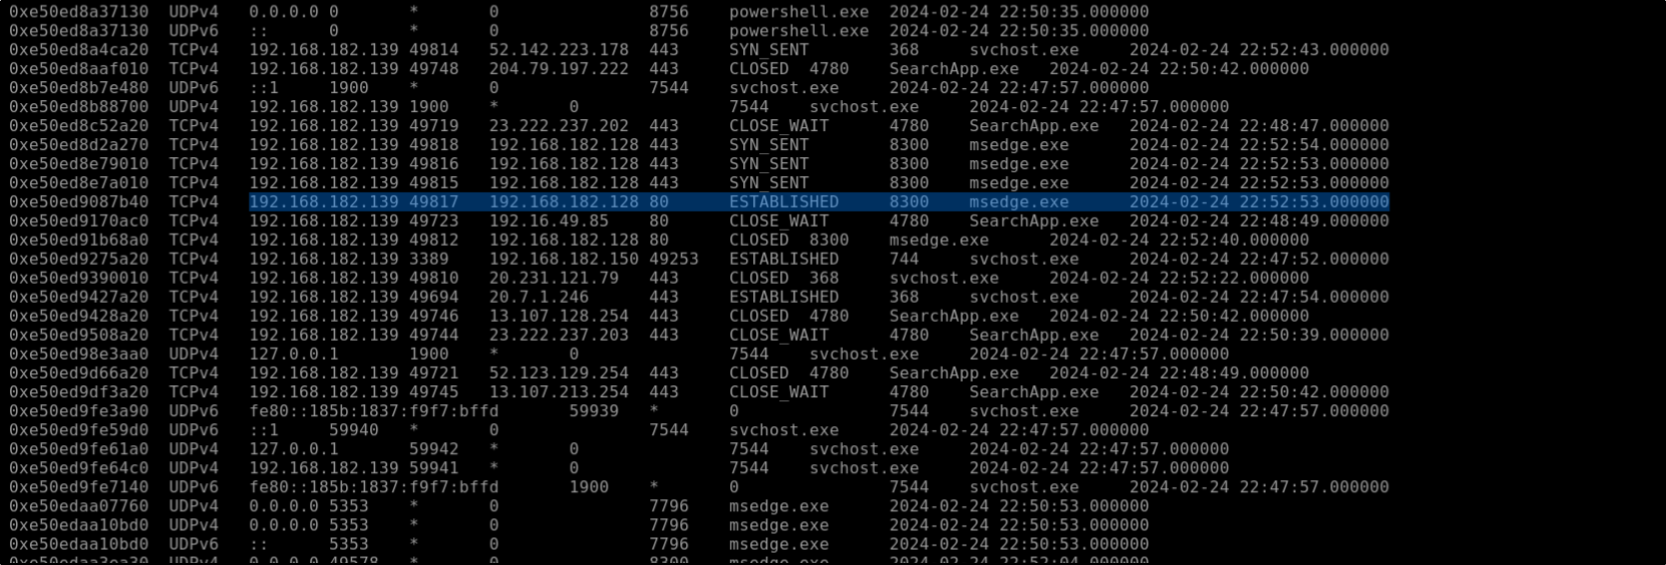
- Using the plugin "windows.netscan," can you identify the program (owner) used to access through port 80?
Ans: msedge.exe
- Analyzing the processes present on the dump, what is the PID of the child process of critical_updat?
Ans: 1612
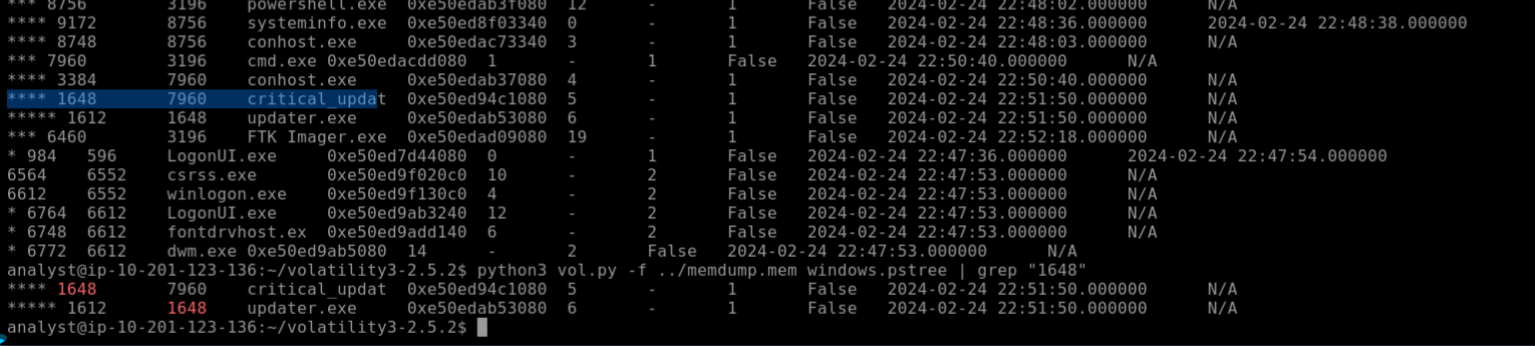
- What is the time stamp time for the process with the truncated name critical_updat?
Ans: 2024-02-24 22:51:50.000000
Task 6: Finding Interesting Data
With the information we have collected, we can investigate the process critical_updat ..which has a child process called updater.exe.
Let's investigate the child process more in-depth.
Let's start by looking at where on the disk it was saved; for that, we can use the plugin windows.filescan which will allow us to examine the files accessed that are stored in the memory dump.

we can observe that the files have been stored in the Directory: C:\Users\user01\Documents\

If we want to have more detailed information like when the file was accessed or modified, we can use the plugin windows.mftscan.MFTScan
Then we take help of cat and grep to sort out
From the below output above, we observe the last four timestamps correspond to the Created, Modified, Updated, and Accessed TimeStamps; we can take notes of those.
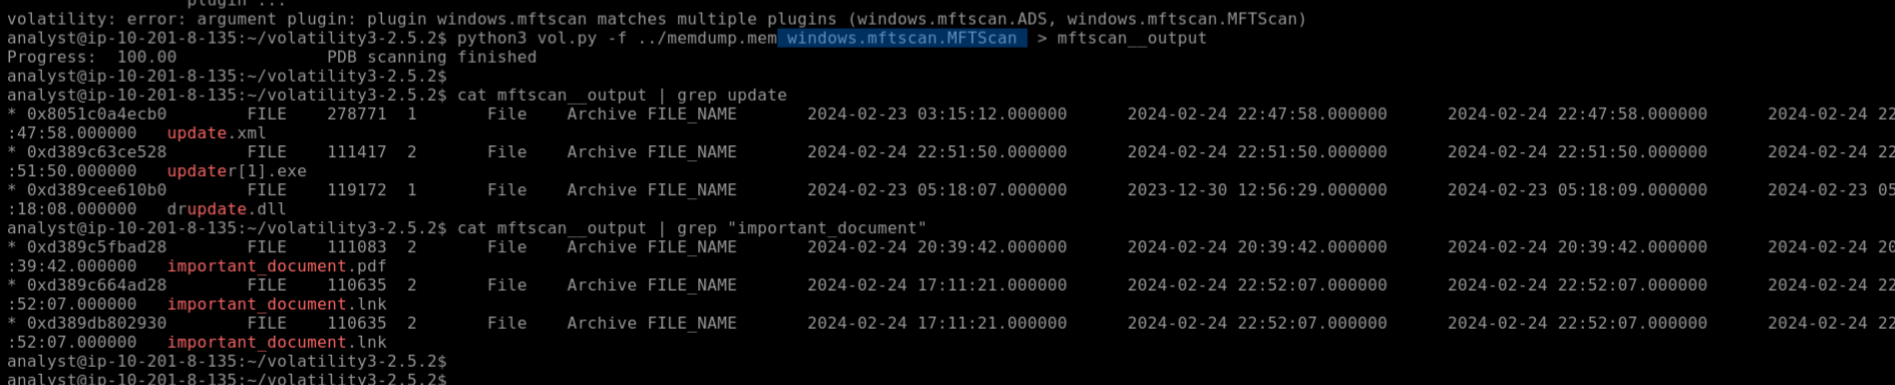
Let's get information on the process.
This time, we will dump the memory region corresponding to updater.exe , and examine it.
To accomplish the above, we'll use the plugin windows.memmap. This time, we'll specify the output dir with the -o switch. In this case, we will use the same directory denoted by the character " . "and the option --dump followed by the option --pid and the PID of the process, which in the case of updater.exe is.

When the command above is finished, we will have a file with an extension .dmp in our working directory.
use strings to get see useful info
strings pid.1612.dmp |less or more
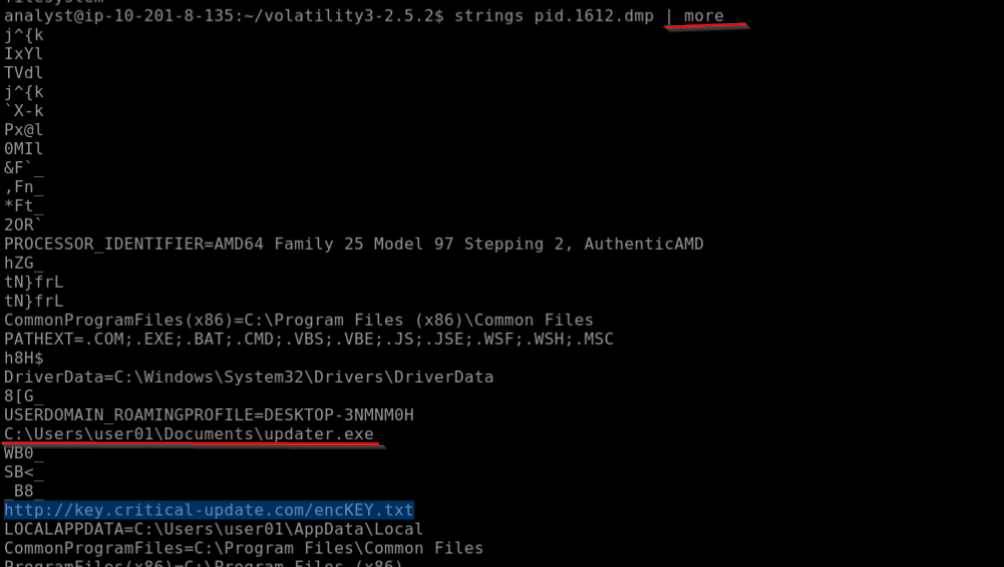
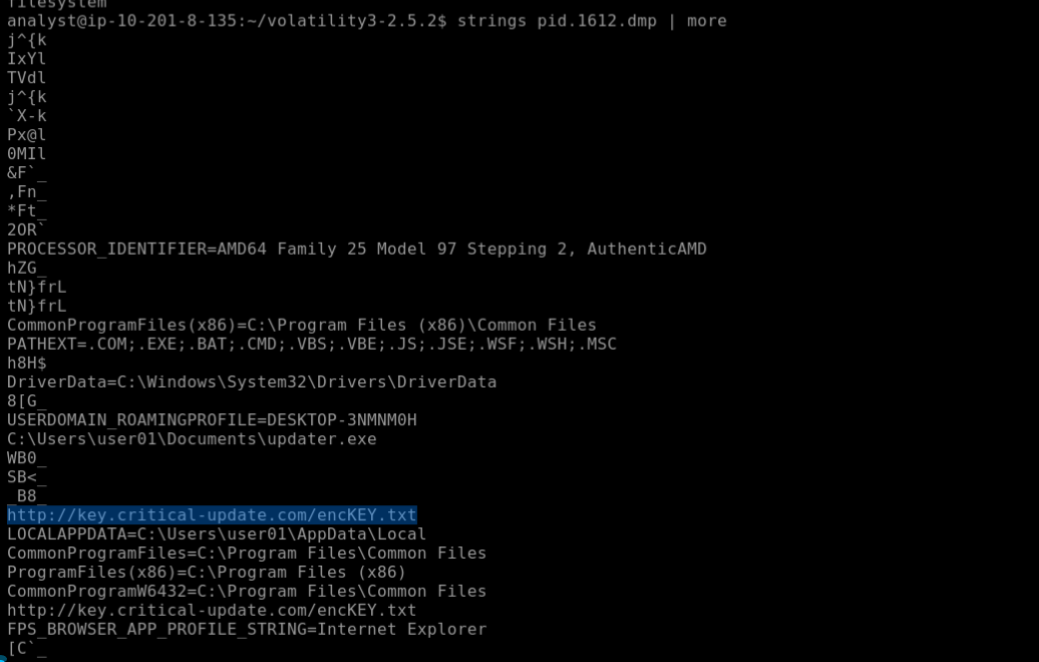
As we can observe, we immediately identified a possible key and a domain from a URL that the process may have accessed. Also, by scrolling down, we found more indications that this is a malicious process since we can find the important_document.pdf filename indicating an interaction with the file.
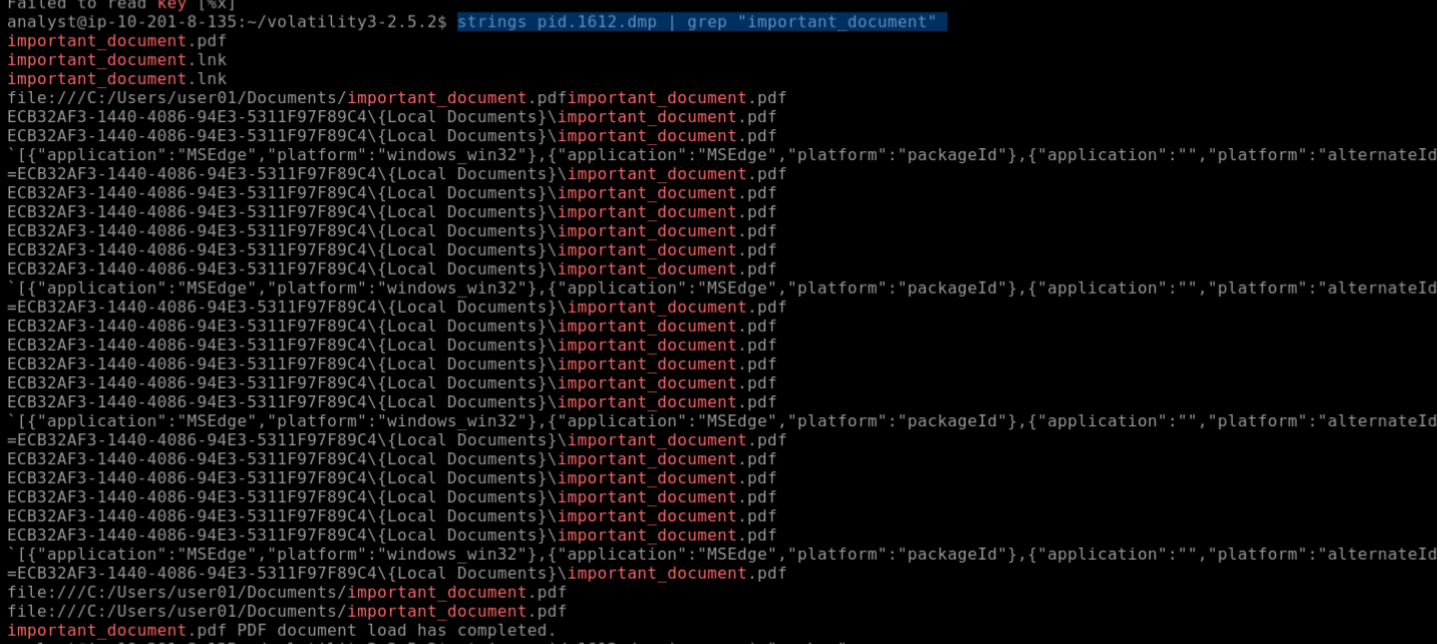
Great, we can infer that the process updater.exe accessed the document important_document.pdf and accessed a "key" at some point in the URL http://key.critical-update.com/encKEY.txt .
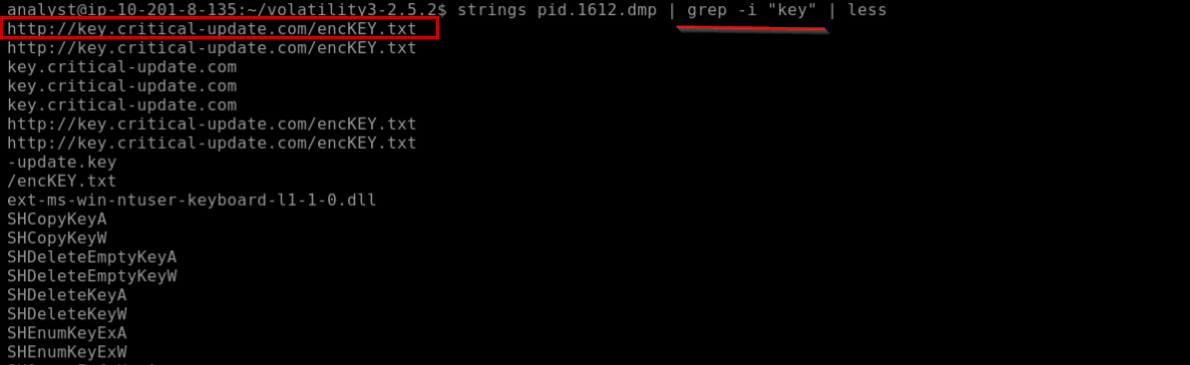
If we use the command grep to look for the HTTP request that may be stored in memory, we can do it using -B and -A to look for 10 lines above and below our match to see if we can spot something else.
strings pid.1612.dmp | grep -B10 -A10 "http://key.critical-update.com/encKEY.txt"
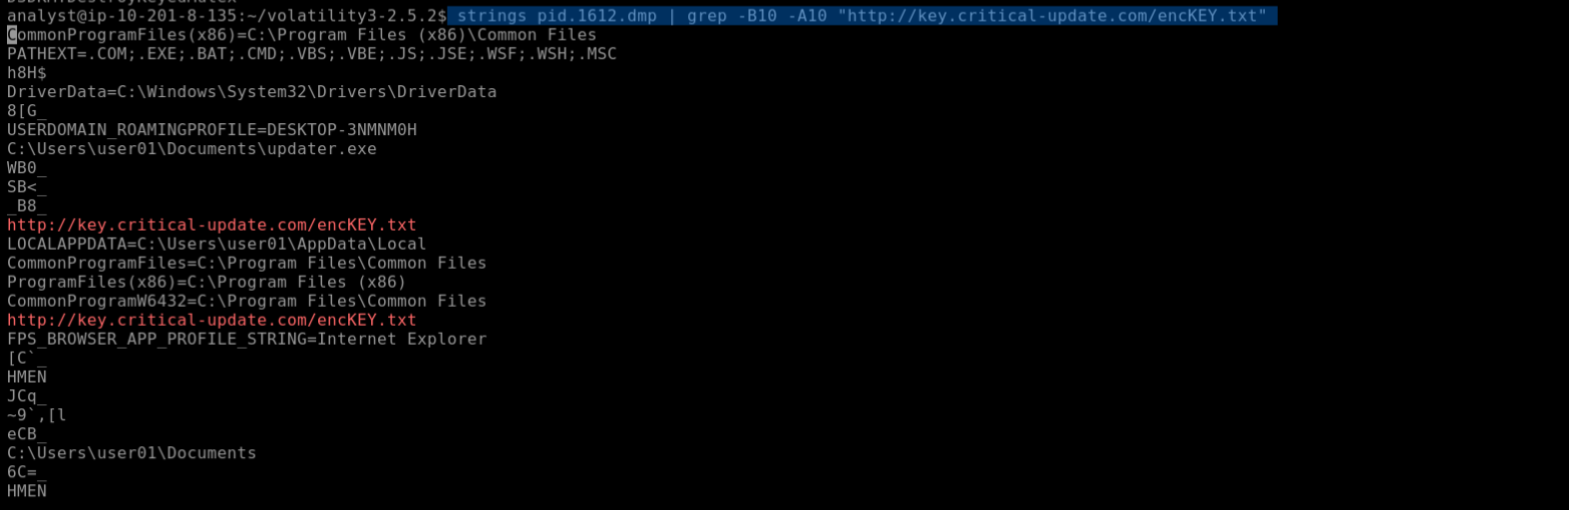
Scrolling up, we can observe the HTTP request, as displayed.
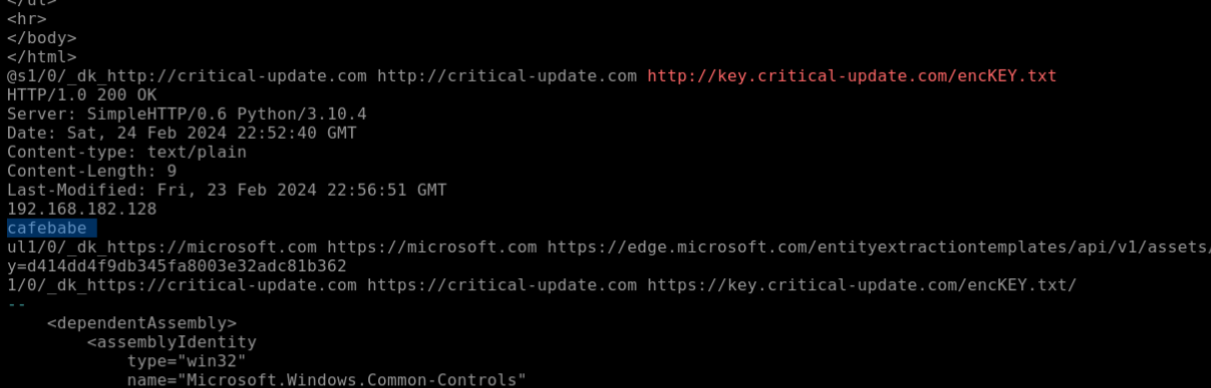
From the above, HTTP response of the HTTP request for the file encKey.txt
we can observe data with the value cafebabe. This could be the key to encrypting the PDF used by the attacker that was not downloaded to disk.
Excellent. We collected valuable information from the memory dump, including the possible key used to encrypt the documents
Answer the questions below
- Analyzing the "windows.filescan" output, what is the full path and name for critical_updat?
Ans: C:\Users\user01\Documents\critical_update.exe
- Analyzing the "windows.mftscan.MFTScan" what is the Timestamp for the created date of important_document.pdf?
Ans: 2024-02-24 20:39:42.000000
- Analyzing the updater.exe memory output, can you observe the HTTP request and determine the server used by the attacker?
Ans: simplehttp/0.6 python/3.10.4
Keep Hunting!


